Leeward Investment Team
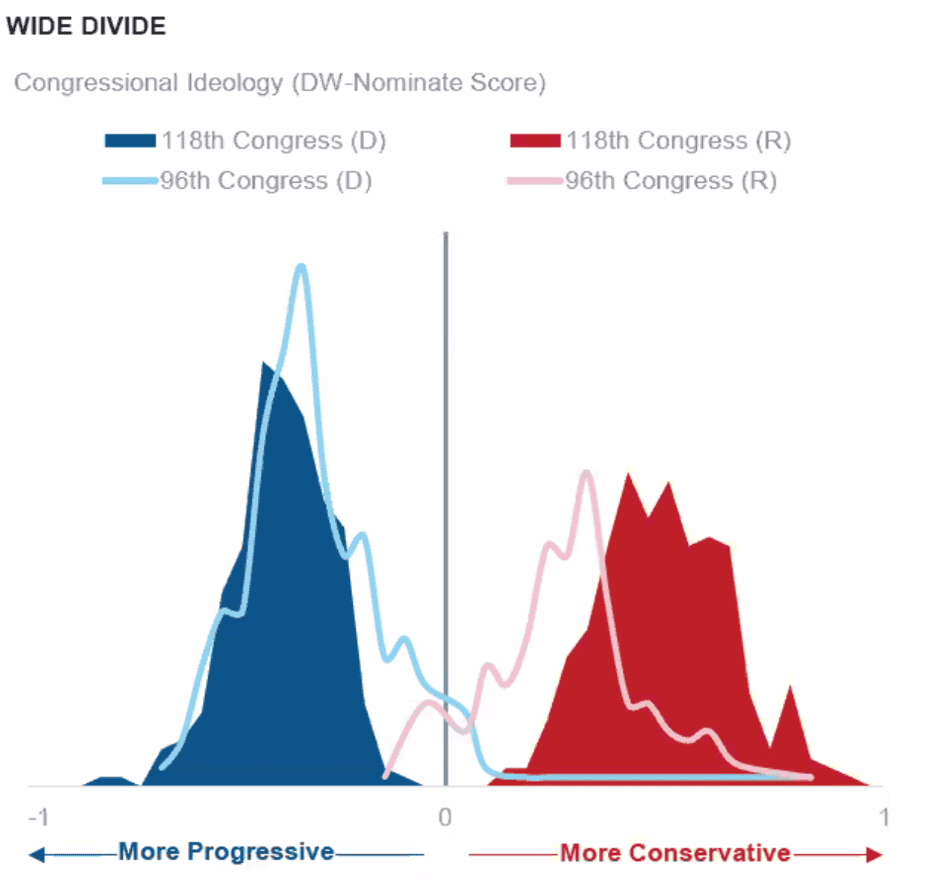
With the presidential elections approaching, we wanted to share our thoughts on how different outcomes might affect your portfolio. Recently, you’ve probably heard strong opinions on the potential impact of either a Harris or Trump administration. The rise of social media, polarized news, and a more ideologically divided Congress has heightened political tension, leaving many feeling uncertain about staying in the market. The graphic below illustrates that, unlike in the 1970s when ideological overlap in Congress fostered opportunities for bipartisan legislation, today's political landscape offers little common ground. As a result, lawmakers on both sides of the aisle often view compromise as more of a capitulation than a collaboration.

Source: VoteView, GovTrack, and Goldman Sachs Asset Management, as of 10/3/24.
Currently, seven battleground states are in play: Nevada, Wisconsin, and Michigan lean Harris, while Georgia, Arizona, and North Carolina lean Trump. If these states hold, Pennsylvania could determine the election. But polling errors in past elections—ranging from 3-5%—mean surprises are possible. The important takeaway is that election outcomes have no clear correlation with market performance, meaning it is wiser to stay invested.
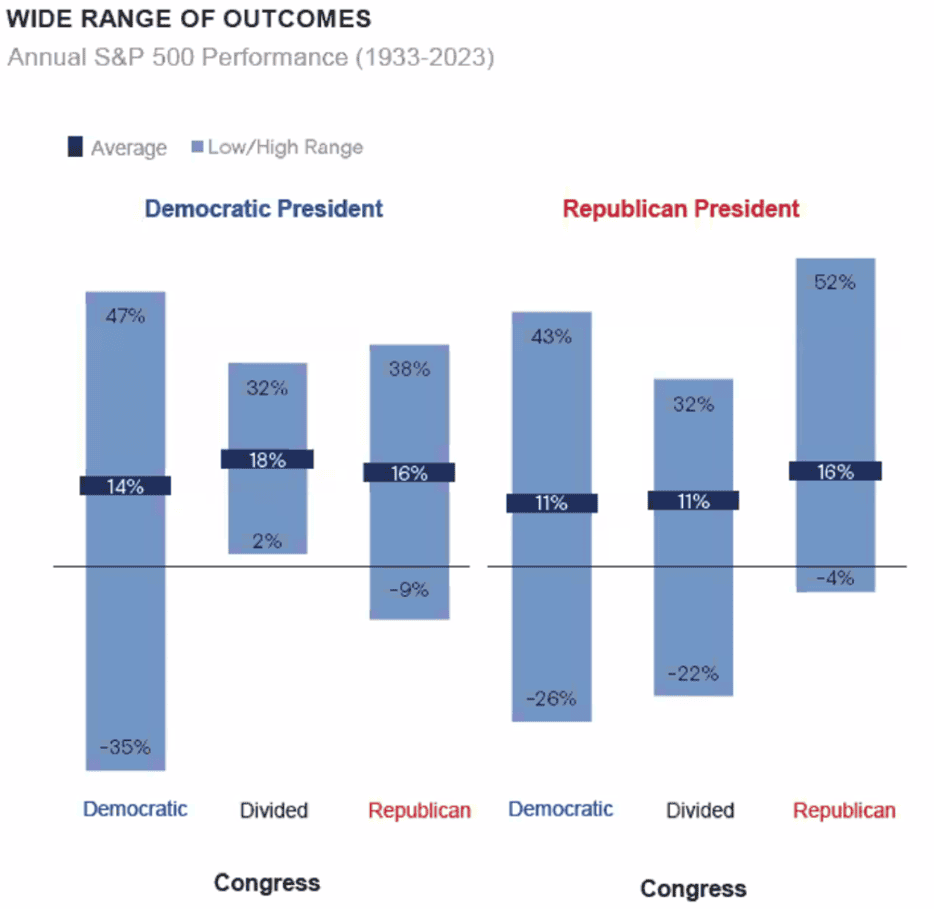
Over the past 90 years, markets have performed best with a Democrat in the White House and a divided Congress—where ambitious ideas are proposed, but gridlock limits major changes. However, regardless of the election outcome, markets typically rise about 15% in the year following an election. As shown in the graphic below, while post-election returns are generally positive and higher than average, the wide variability makes investing based on political outcomes an unreliable strategy.

Source: Bloomberg, Goldman Sachs Asset Management, as of 9/30/24.
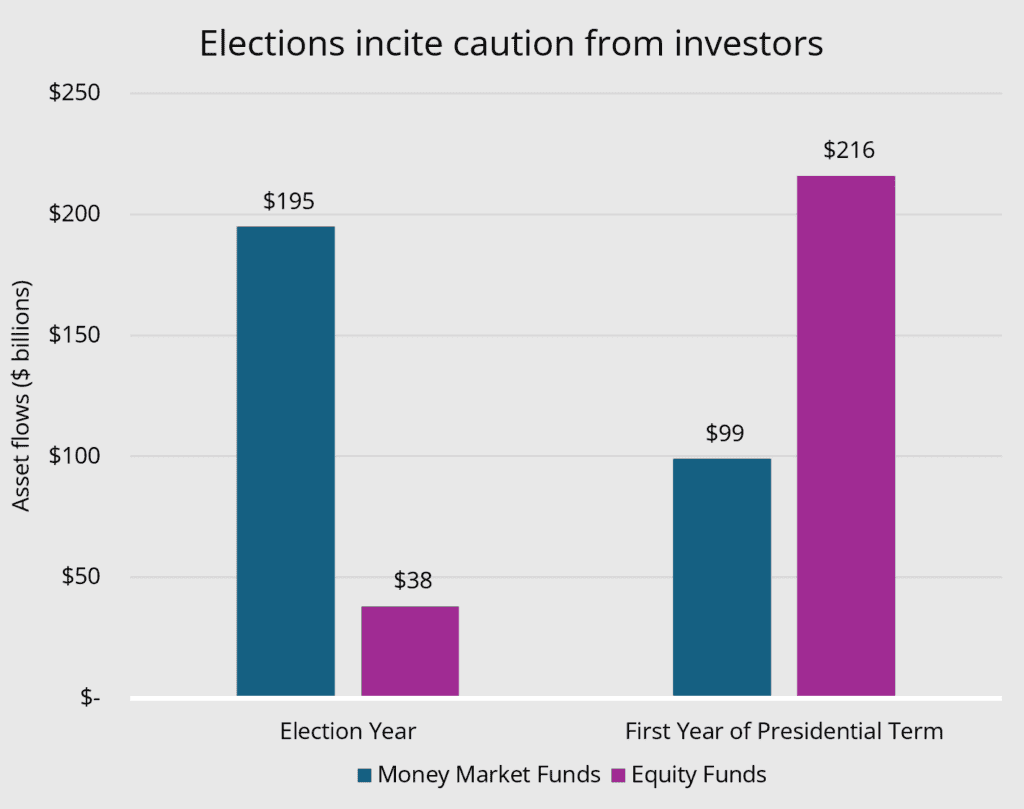
Unfortunately, many investors don’t stay the course and end up trying to time the market. In the average election year, investors often pull out of equities and move into cash, only to re-enter the market after the election, while some remain in cash. When the market is up 15% on average, that’s a missed opportunity. The chart below highlights this pattern: fund flows into money market funds (blue) are five times higher than into equity funds leading up to the election, while the following year, flows into equity funds (purple) are roughly six times what they were the previous year.

Source: Morningstar, Goldman Sachs Asset Management, as of 9/30/24.
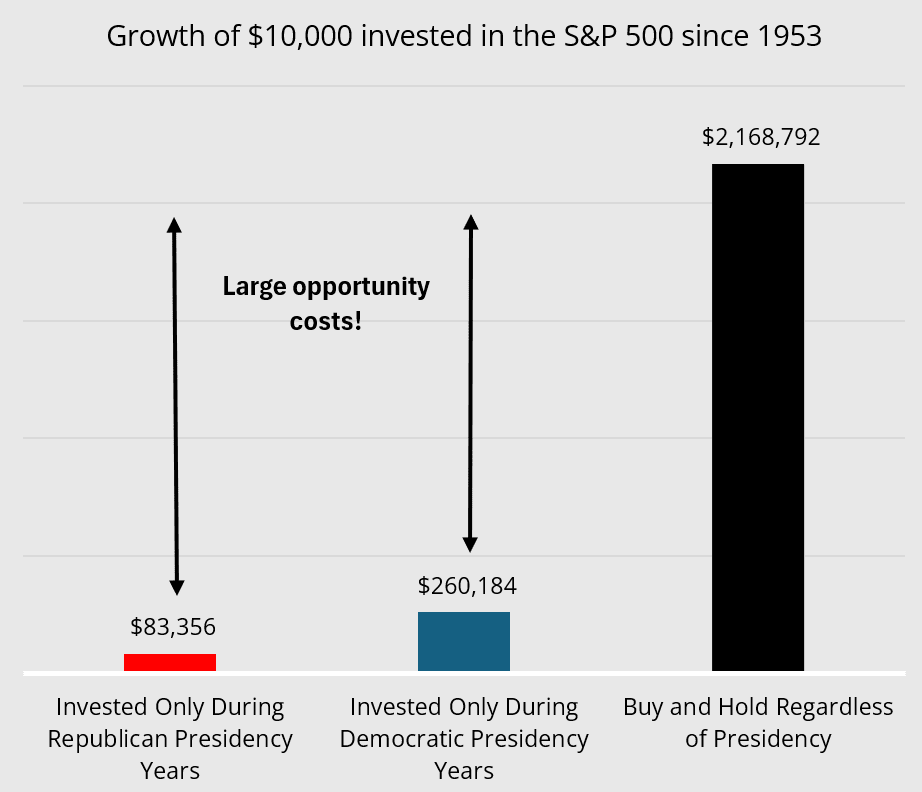
Consider this: If you had invested $10,000 in 1953 and only stayed in the market under Republican presidents, you’d have about $83,000 today. If you’d only invested under Democratic presidents, you’d have around $260,000. But if you stayed invested regardless of politics, that same $10,000 would have grown to nearly $2.2 million.

Source: Bloomberg, Goldman Sachs Asset Management, as of 9/30/24.
In short, letting politics drive your investment decisions can be costly. The best course of action? Stay invested, and let your vote—not your portfolio—be your political statement.
We hope you're enjoying the Fall season and are happy to discuss any questions you have.
Sincerely,
Jim and Mike

jim@leewardfp.com

mike@leewardfp.com